
S-Curve adoption models are frequently referenced to describe the adoption of new technologies. The S-curve is a graphical representation of how a new technology diffuses through a population over time. This is a contrast to the market perspectives which are typically only valid at a given point in time. Both can be affected by the specific market strategies of technology proponents. The curve has an S-shape because it starts slowly, then accelerates, and then slows down again as it reaches saturation. The S-curve can be divided into four phases:
- The introduction phase is when the technology is first invented or introduced to the market, and only a few innovators adopt it.
- The growth phase is when the technology gains popularity and acceptance among early adopters and early majority, and its adoption rate increases rapidly.
- The maturity phase is when the technology reaches its peak adoption among late majority, and its adoption rate slows down as it approaches saturation.
- The decline phase is when the technology becomes obsolete or replaced by a newer technology, and its adoption rate decreases as only laggards remain.
S-Curve
Several mathematical formulae for S-Curve Adoption Models have been developed in modeling various physical phenomena and can also be applied for technology adoption. The main models are:
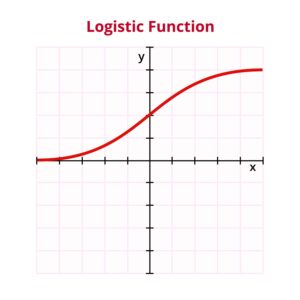
- Logistic Curve: This S-Curve Adoption Model is based on a differential equation that accounts for the limited potential market size and the diminishing returns of adoption. The logistic curve can also be divided into four phases similar to the S-curve: introduction, growth, maturity, and decline.The logistic curve can be expressed by the formula:y=L/(1+e^(-k(x-x_0)) ) where y is the cumulative adoption level, L is the maximum potential market size, k is the growth rate, x is the time variable, and x_0 is the inflection point where the adoption rate reaches its maximum.
- Bass Diffusion Model: This S-Curve Adoption Model assumes that there are two types of adopters: innovators and imitators. Innovators are those who adopt the technology independently of others, while imitators are those who adopt the technology based on social influence or word-of-mouth. The model can also generate an S-shaped curve similar to the S-curve and the logistic curve. The Bass Diffusion model can be expressed by the formula: f(t)=(p+qF(t))/(1+qF(t)) where f(t) is the probability of adoption at time t, p is the coefficient of innovation, q is the coefficient of imitation, and F(t) is the cumulative fraction of adopters at time t.
While S-Curve Adoption Models provide some insight into the deployment scale of a particular technology over time, they do not provide insight into any individual or aggregate decision where market participants would grapple with the ethical considerations of technology adoption.
Are you a technical, business or legal professional who works with technology adoption? Do you want to learn how to apply ethical frameworks and principles to your technology work and decision-making, understand the legal implications and challenges of new technologies and old laws, and navigate the complex and dynamic environment of technology innovation and regulation? If so, you need to check out this new book: Ethics, Law and Technology: Navigating Technology Adoption Challenges. This book is a practical guide for professionals who want to learn from the experts and stay updated in this fast-changing and exciting field.